
Know where the job stands while it's still running.
- Budget vs actual hours for every project, live from the field
- Burn rate and projected end date, so overruns surface early
- Drill into any project by cost code, job site, or equipment
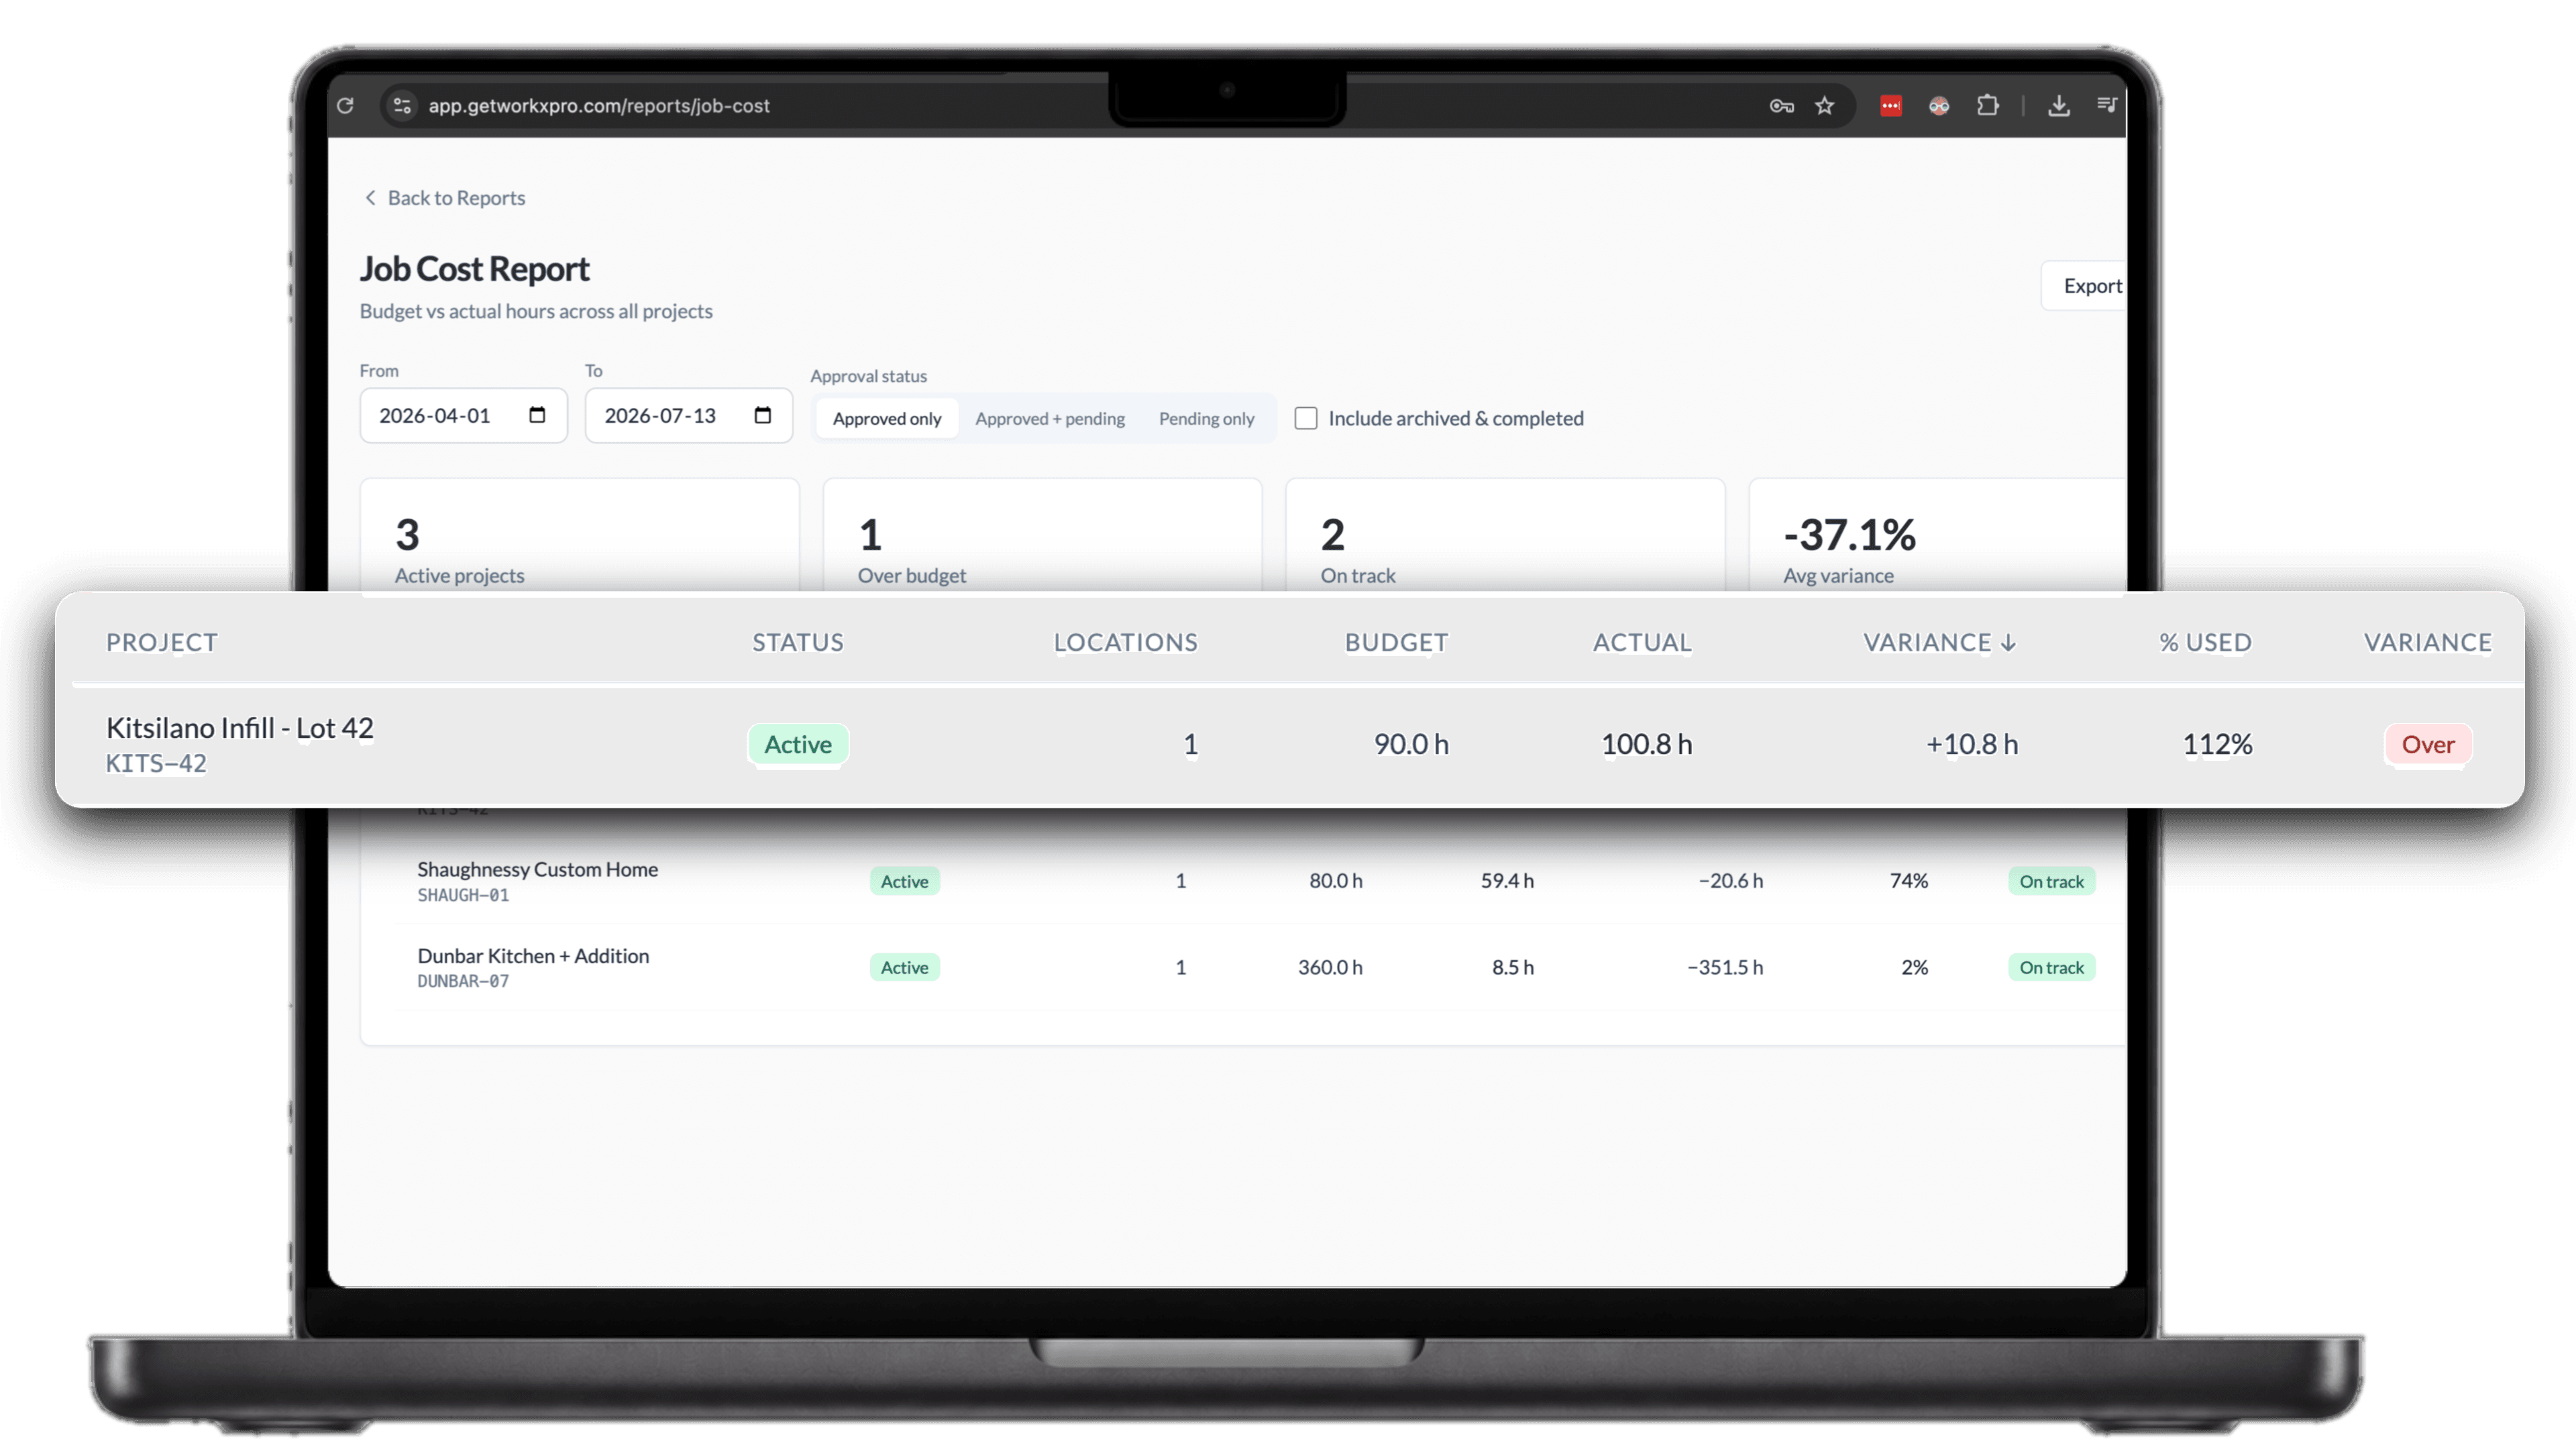
You know the job went over. You just can't tell where.
Costing by reconstruction
Cost codes get assigned by the office days later, from memory and best guesses. The report that comes out the other end is fiction with a nice layout.
One bucket for a split day
A worker spends four hours framing and three on another site, and all seven land on whichever job was easier to log. One project eats costs that belong to another.
Reports that arrive after the damage
By the time anyone runs the numbers, the job is wrapped and the overrun is history. There's nothing left to manage, only something to explain.
Every code, tracked against its budget
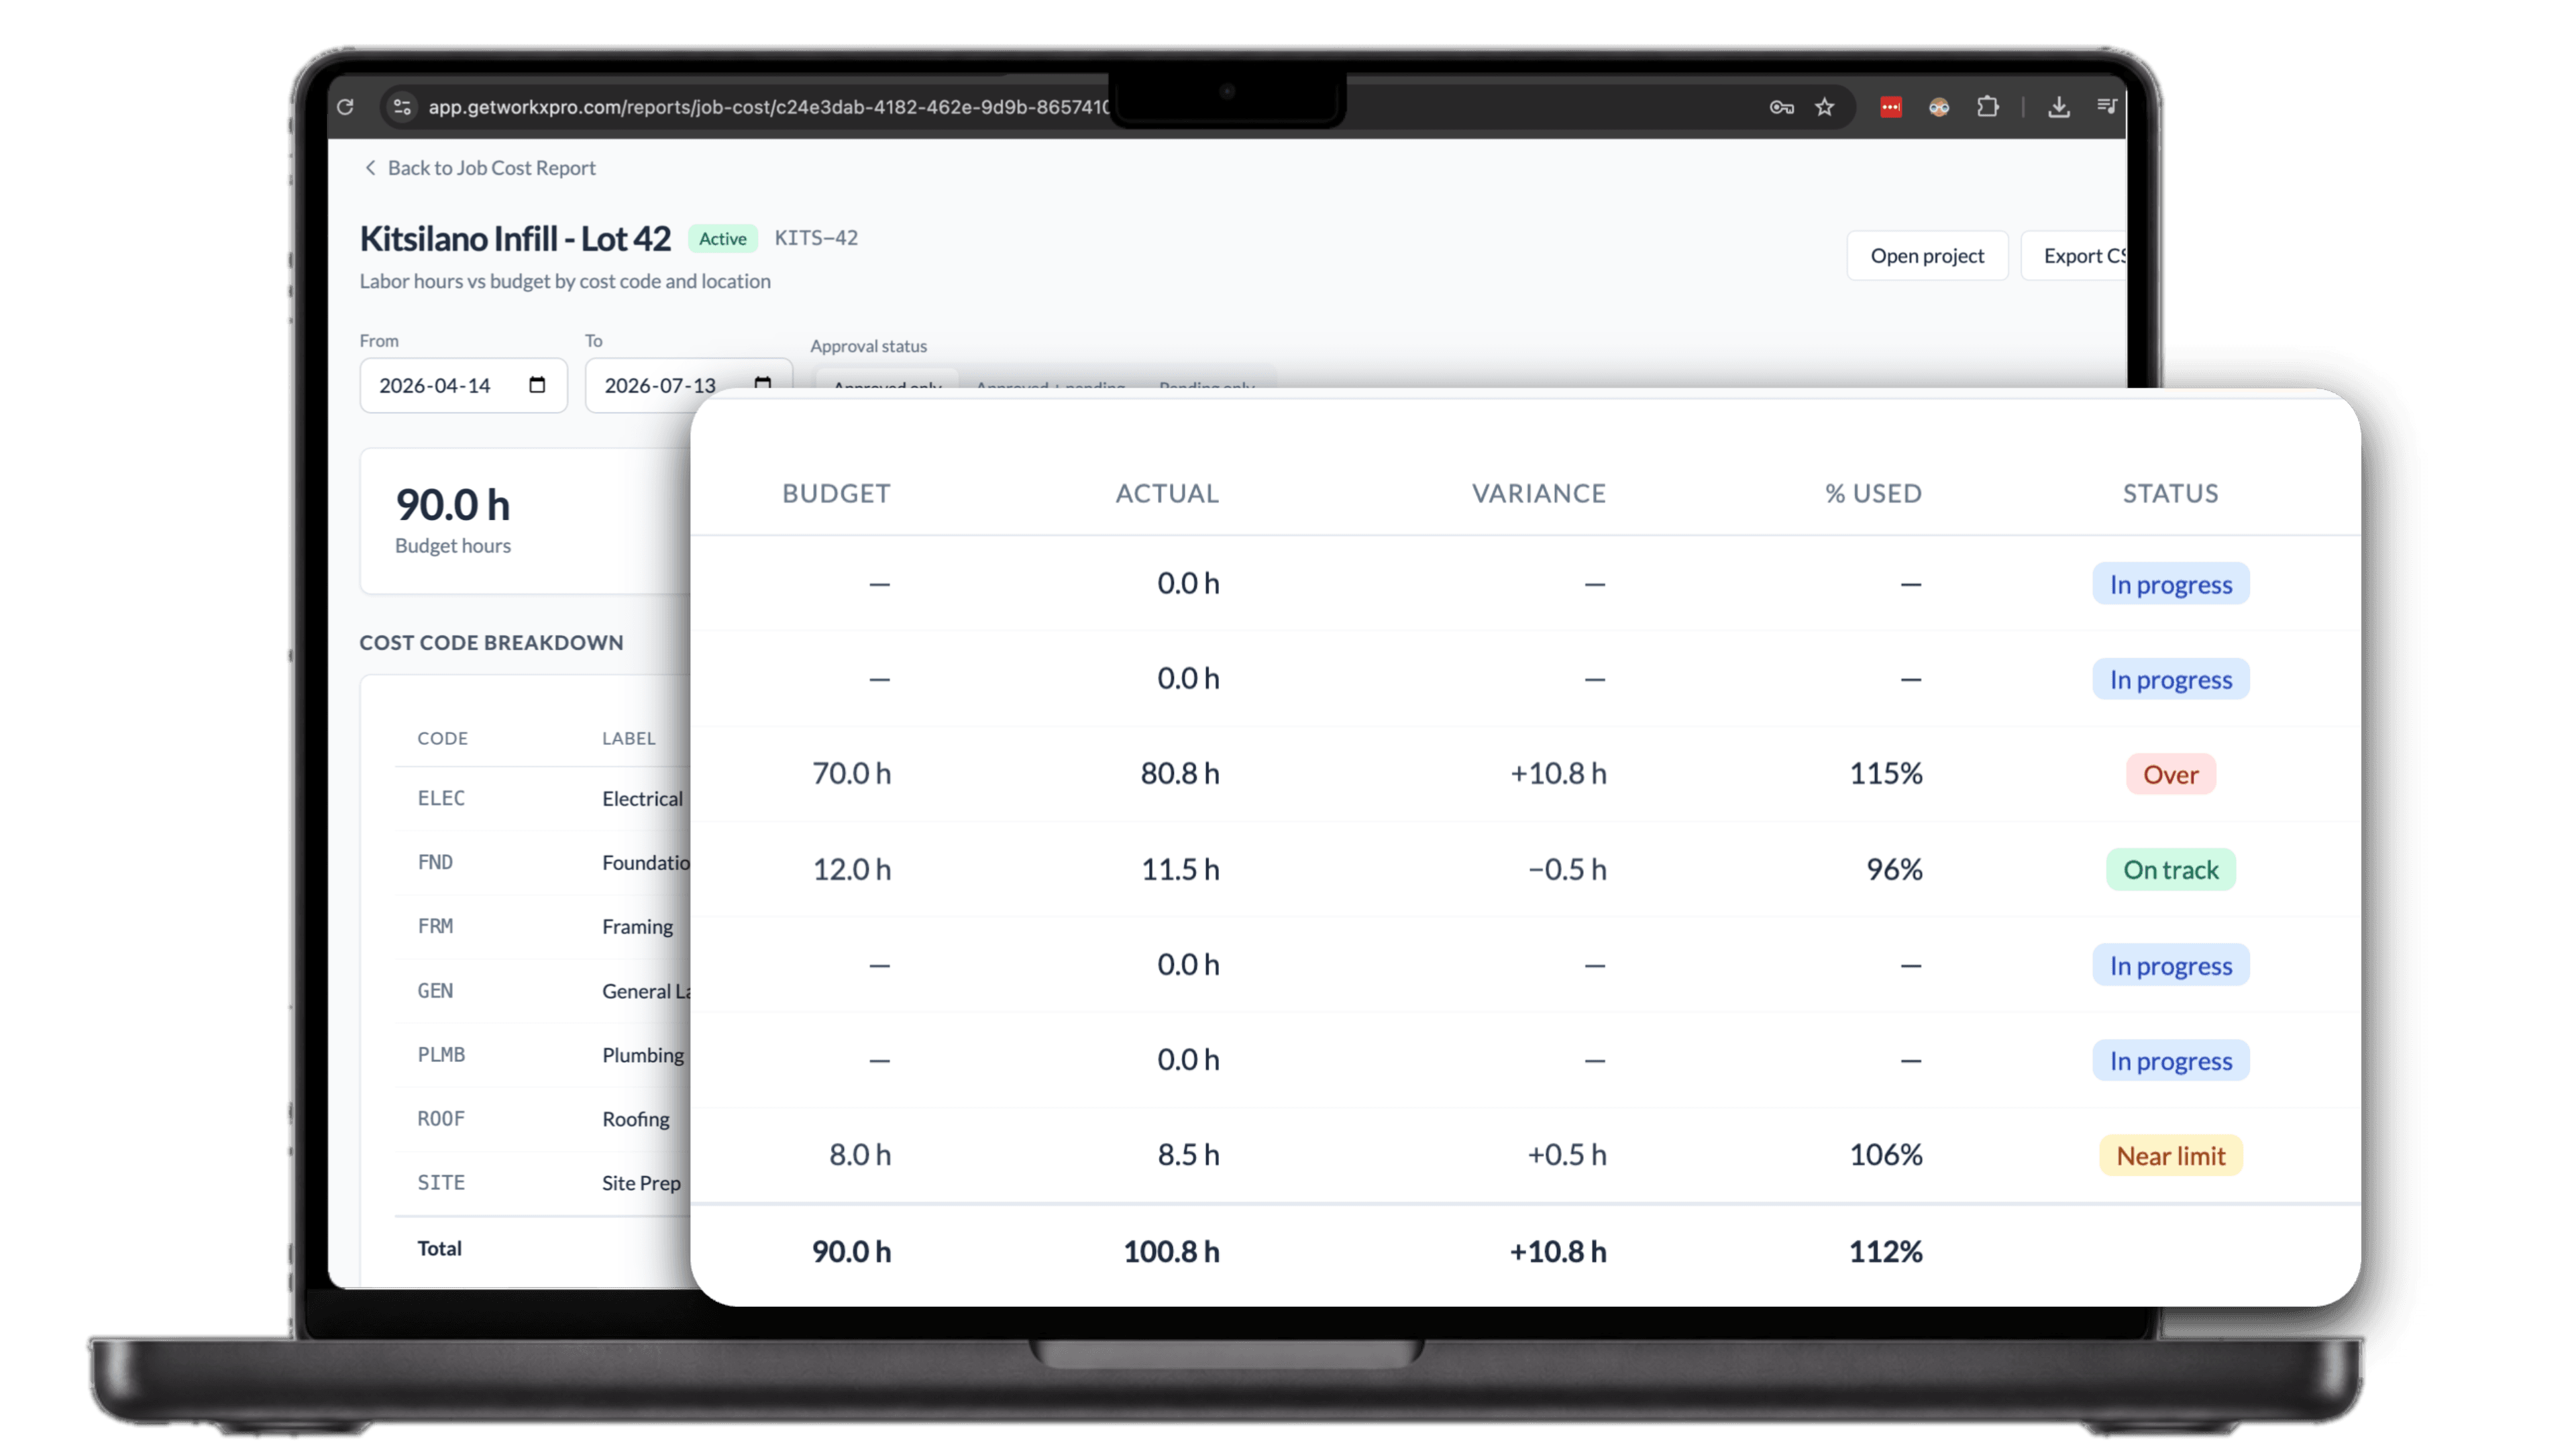
Open a project and every cost code shows budget, actual, variance, and percent used, with a status you can read at a glance: on track, near limit, or over. The numbers come from codes workers picked at clock-in, not codes someone assigned after the fact.
Where it happened, and what was running
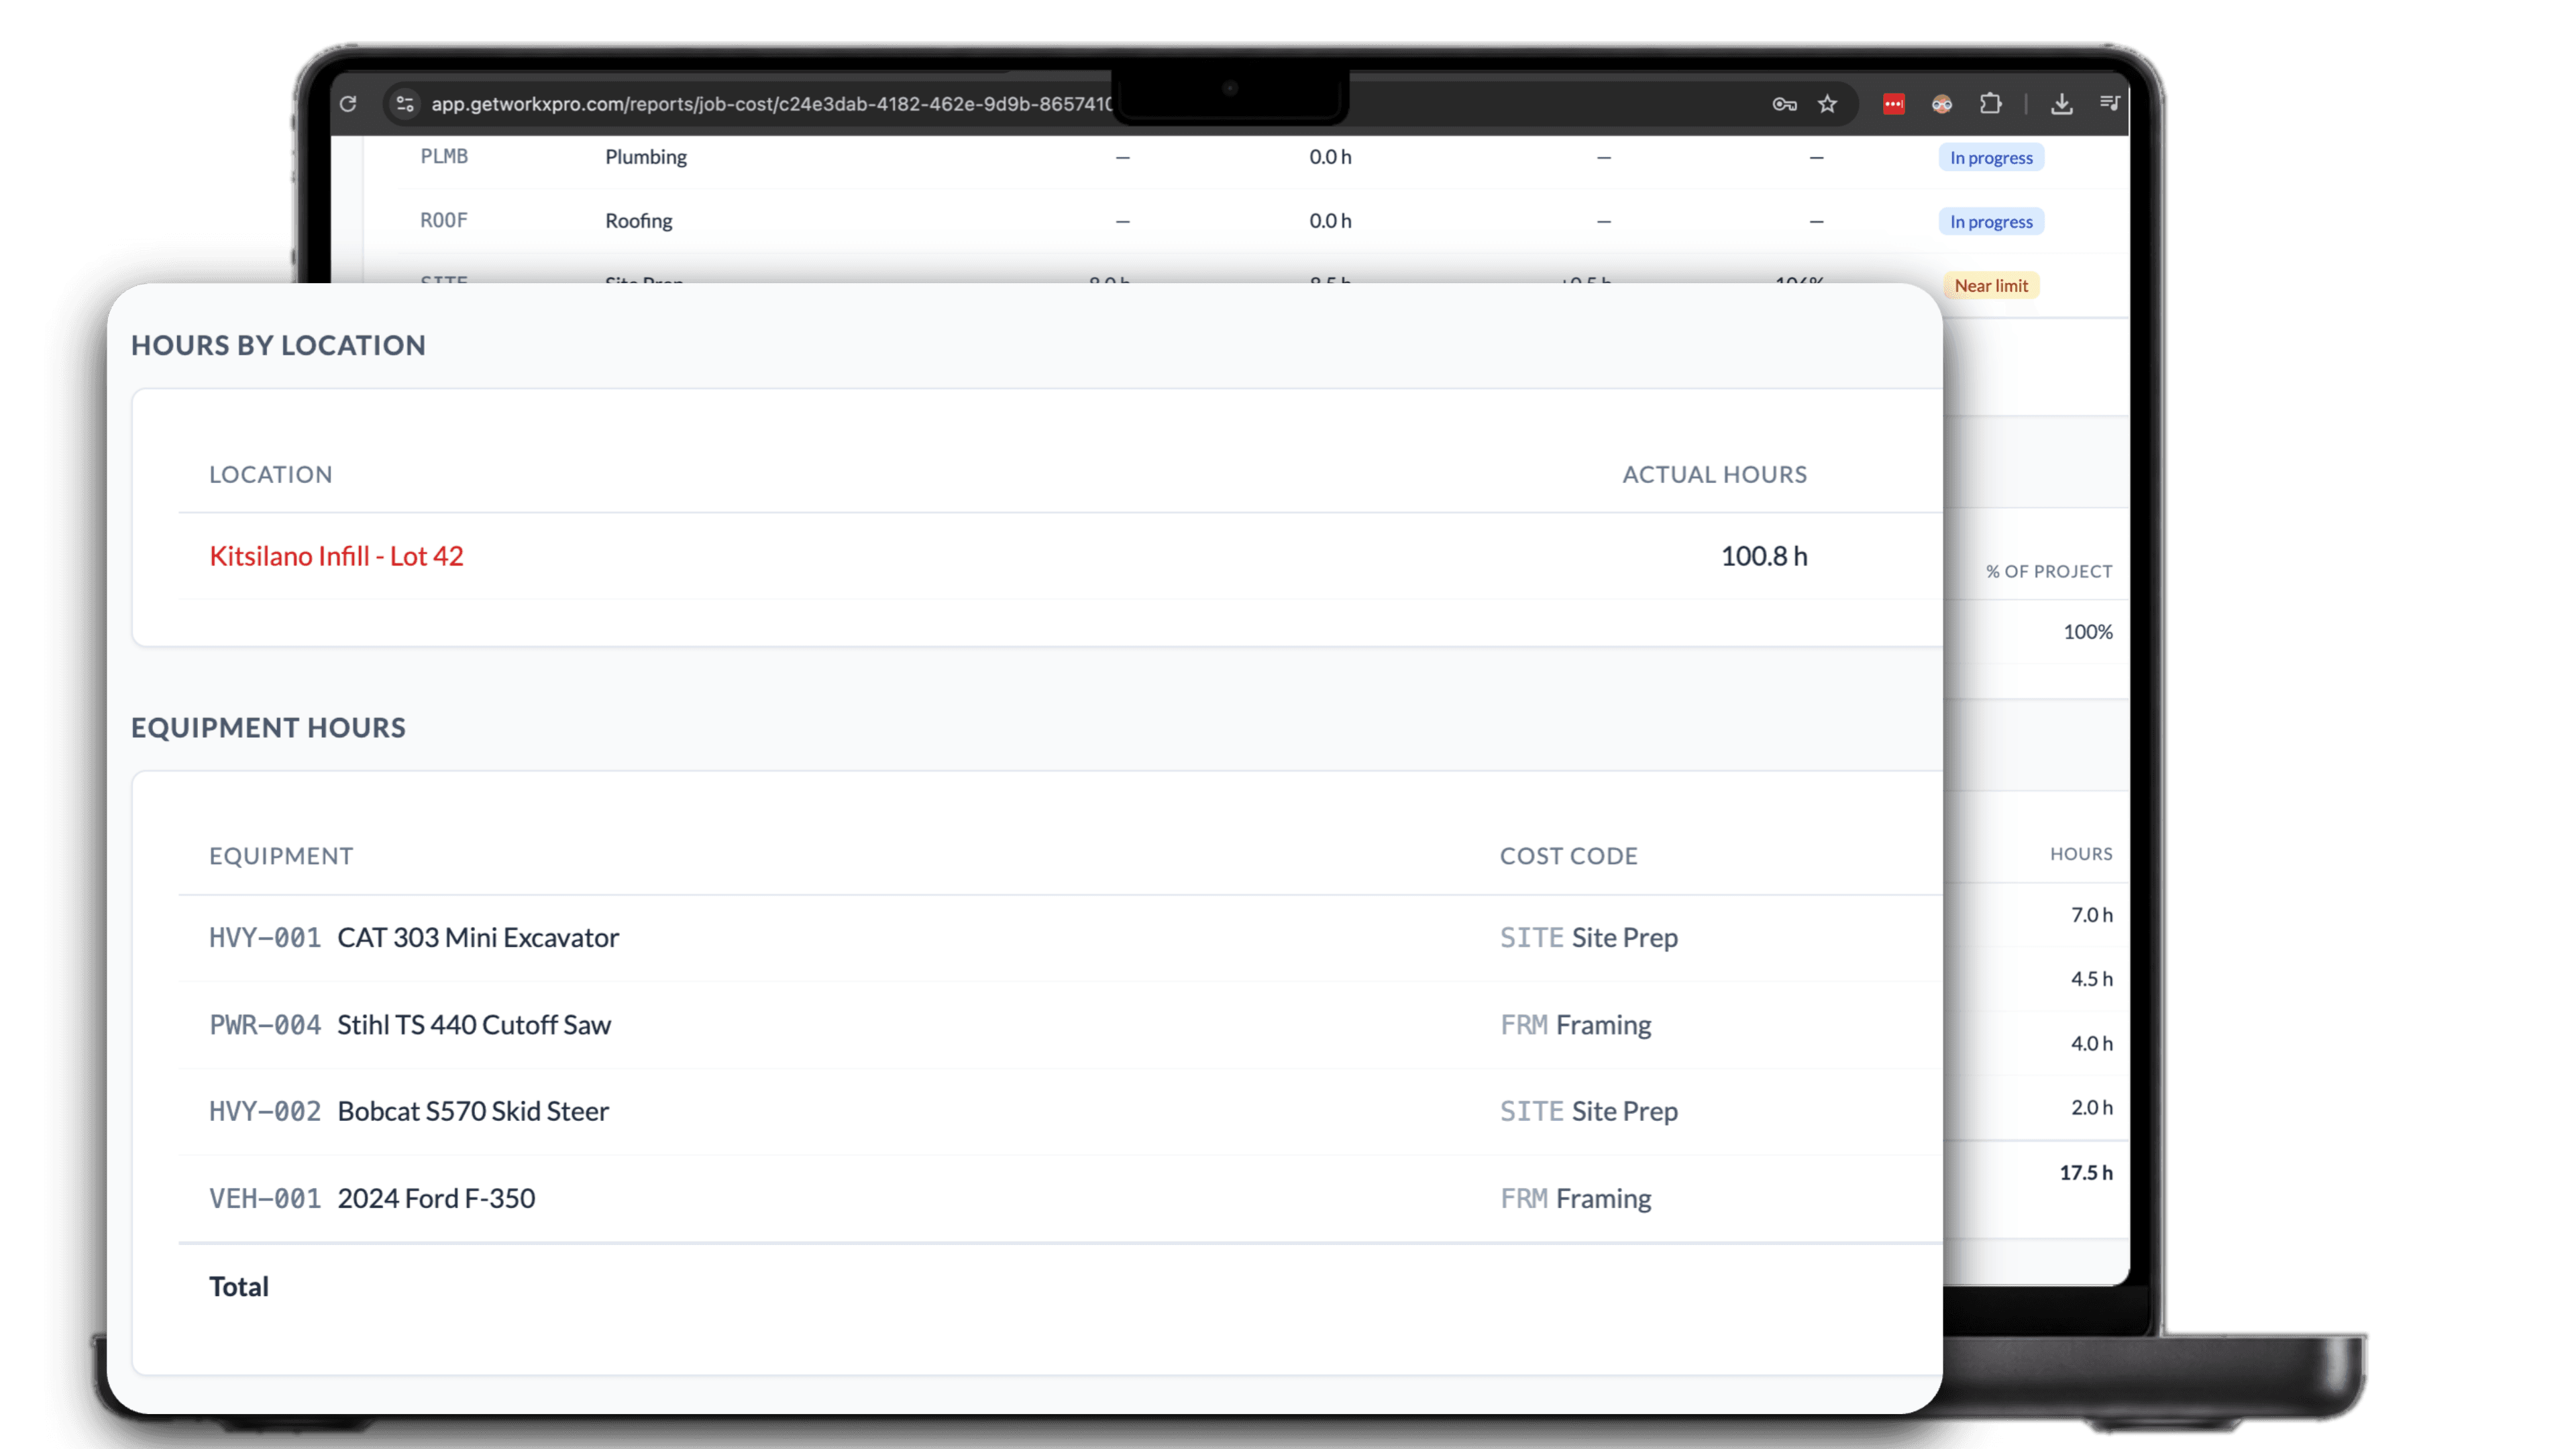
The same report breaks hours out by location and pulls in equipment time, with every machine's hours tied to a cost code. When site prep runs over, you see the excavator hours that went with it, instead of arguing from a single total.
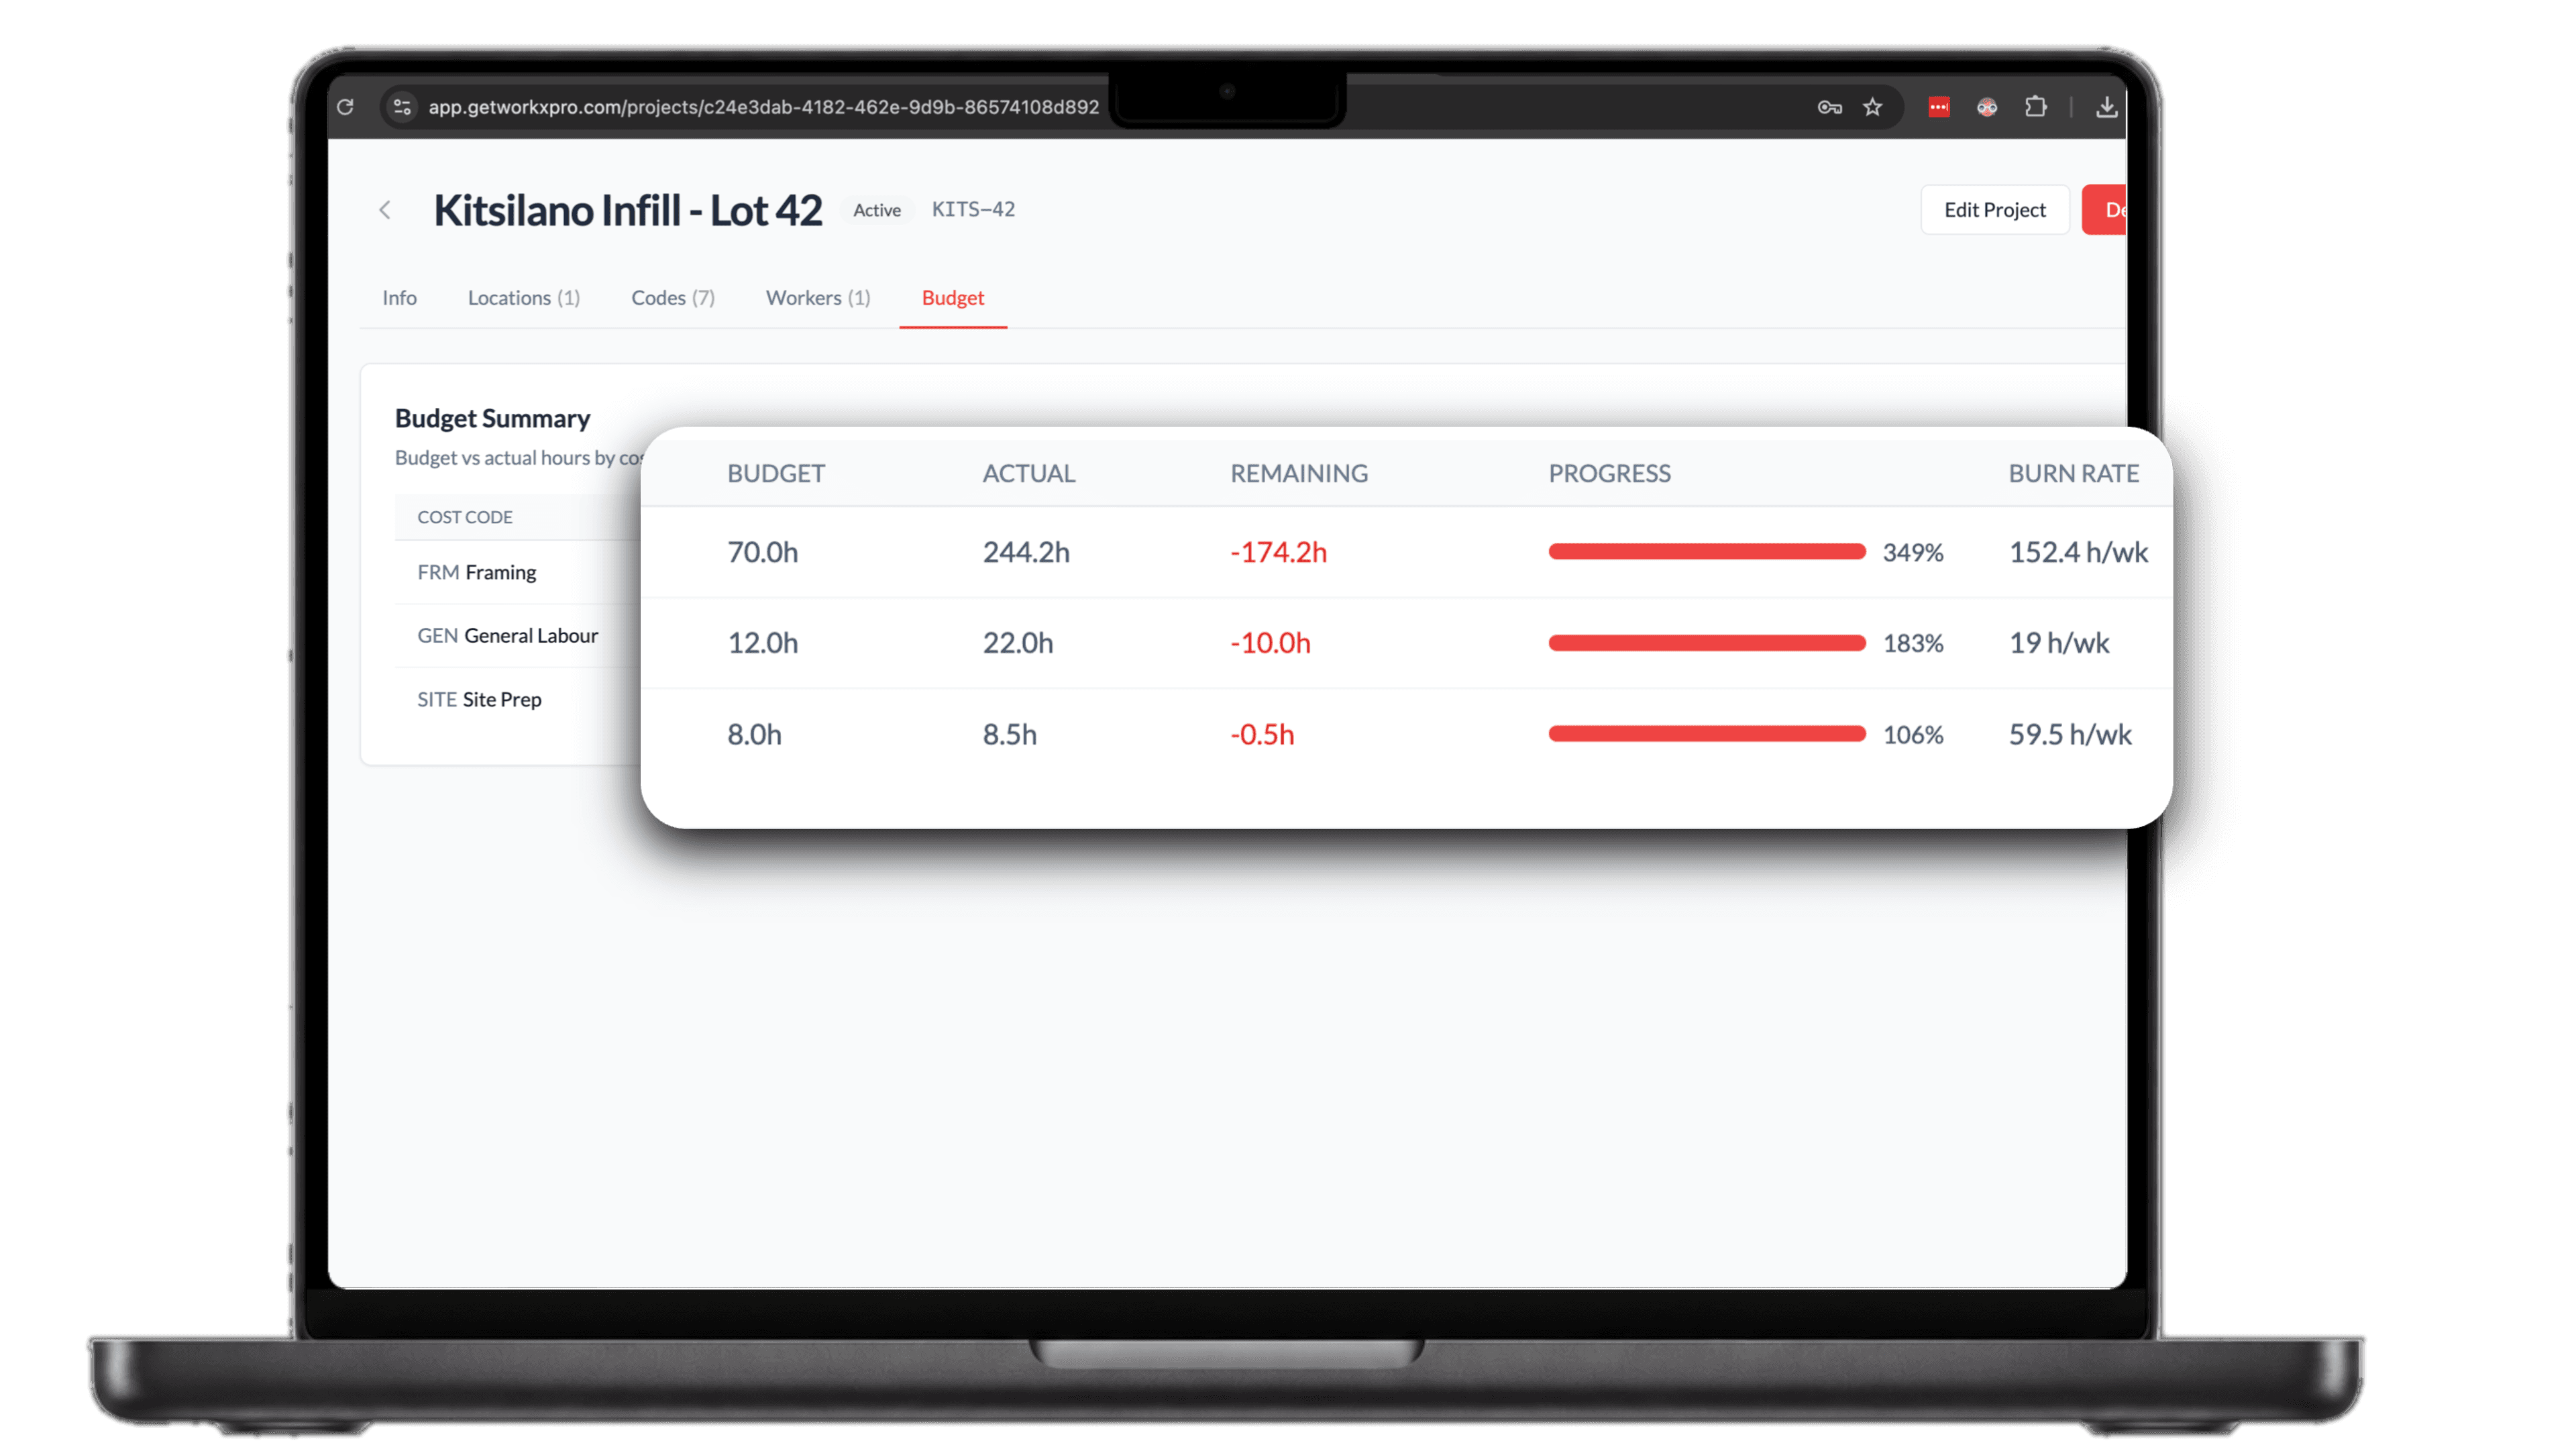
Overruns show up while you can still act
Each cost code carries its budget in hours, and every punch counts against it as it happens. Burn rate shows how fast a code is eating its budget and the projected end date shows where it lands, so the conversation happens mid-job, not at the post-mortem.
See how WorkxPro fits the way you work.
Construction Companies
Track hours across job sites and cost codes
Learn more →
Cleaning Companies
GPS-verified hours at every client building
Learn more →
Field Service Businesses
Quotes, scheduling, and invoicing in one app
Learn more →
Foremen & Supervisors
Approve hours and watch crews from your phone
Learn more →
Payroll Admins
Clean digital timesheets straight to payroll
Learn more →